Business Retention and Expansion (BRE) Programs: Preparing a Written Report of Survey Findings and Recommendations1
Introduction
This report, by its very length, defends itself against the risk of being read—Winston Churchill
Prime Minister Churchill was right in his complaint about long, difficult-to-read reports. Once they are published, many reports are never read—they just sit on shelves gathering dust. Beyond the obvious requirements of good content and well-documented findings, conclusions, and recommendations, there are strategies that can be employed to maximize the readability of reports and enhance the chances that they will be read, understood, and utilized. Using language and terms familiar to readers, providing a guide to the layout of a report, and following a logical and consistent format help make reports effective and attract multiple audiences (The Structure of Business Reports 2000).
This publication is seventh in a series on establishing BRE programs, which is online at the EDIS website at https://edis.ifas.ufl.edu/TOPIC_SERIES_BRE.

Credit: istocksdaily/iStock/Thinkstock.com
Design Reports with Readers in Mind
Research has shown that people have different learning styles. Writers must keep this in mind. Hilligoss (2000) notes that readers approach documents in various ways, depending upon their goals. Readers may want to
-
Skim for general meaning of whole document.
-
Scan quickly for specific meaning.
-
Search thoroughly to comprehend specific information.
-
Read receptively for thorough comprehension of document.
-
Read critically for evaluation of document.
Knowing what potential readers want and how they read to meet their goals will help you design the layout and structure the content of reports to ensure maximum readability and usefulness. In addition, visual design and text arrangement are important in writing reports. There are several visual rules to be followed:
-
Do not be afraid of white space.
-
Leave adequate margins.
-
Start sections on new pages.
-
Do not place headings on a page without some accompanying narrative.
-
Crowded text and graphics make the document difficult to read and may obscure important information (How Project Managers Write Useful Reports 2019).
Formatting the Report Content
Title Page
The title page should usually contain only the title of the report, the author(s), and the date the report was submitted (or adopted). However, if the report was sponsored by an outside organization, it is appropriate to identify the sponsor and the official project identification number (if applicable) on the title page.
Executive Summary
The executive summary immediately follows the title page. While its place in the report is at the beginning, it is usually written after the detailed report is completed. It should be brief; some authors recommend a limit of three pages. It should also be comprehensive, so that those who read only this portion of the report will have a clear understanding of the objectives of the activity that led to the production of this report and its findings and recommendations. Each important point should be identified with a bullet or similar identifying marker and described in a brief sentence or two. Leave a blank line between each bulleted point.
Table of Contents
Reports on the results of a business retention and expansion survey will inevitably be longer than one or two pages. Thus it is important to include at the beginning of the report a "road map" to the document. A table of contents provides the reader with a means of accessing information without having to search through the entire document. The table of contents should stand alone in the report and be titled as such. It should list all the sections of the report and should include both the title of the section (or subsection) and the page on which it begins. The section and subsection titles should be identical to the wording in the body of the report, and of course the page numbers must be accurate. Some word processing programs provide an automatic feature that links the actual page numbers to the table of contents so that any changes in the body of the report that result in moving a section or subsection to a new page can be updated automatically. Additional items to be included in the table of contents are lists of appendices, tables, and figures (charts, graphs, and pictures).
For reports that contain a significant number of appendices, tables, and/or figures, it may be advisable to create new pages for each list. Just as with the section headings, the name of the item being referenced and its page number should match the actual item name and location in the body of the report. If these are included as separate pages, then each page would begin with a heading identifying the content of the page.
Introduction
The introduction may be viewed as an expanded and amplified executive summary. It is designed for those readers who wish to get a quick picture of the organization of the report. It should briefly lay out the structure of the body of the report and may be broken into subsections to assist the reader in navigating through the report. If subsections are desired for BRE reports, then at least two are recommended: (1) Background on the Project and (2) Background on the Community.
Background on the Project
The background on the project begins with a statement of why the project was undertaken. It should include information on the goals of the survey and outline the process that led to the development and implementation of the survey project. This subsection may be used to acknowledge the use of any outside assistance and to describe the methodology used to collect the data. However, if there is a need for more detail in acknowledgments and methodology, these may be shown as separate subsections:
-
Acknowledgment: This subsection is used when the survey process included the outside assistance of volunteers in data collection, data analysis, and preparation of the report. Some consideration should be given as to whether to personally identify every individual involved in the project. It may also be appropriate to identify the businesses that participated in the survey and any individuals or organizations that provided physical or fiscal assistance.
-
Methodology: This subsection provides the reader with information about the survey process; the number and types of businesses contacted (if appropriate); how the interview sample was selected; and how the data were collected, tabulated, and analyzed.
Background on the Community
The Background on the Community section should include as much information on the community as deemed necessary to aid in the interpretation of report findings and recommendations. Some sort of socio-economic profile should be included and, if helpful, a comparison should be made with similar communities or state averages.
Body
The body of the report follows the outline laid out in the introduction. The "meat" of the report, it contains the summarized findings of the business surveys and any appropriate information needed to assist the reader in understanding how the author(s) arrived at specific conclusions and recommendations.
Organizing Information within the Sections of the Body
While there is no single ideal way to organize information in a report, a numbering system allows for a logical ordering of the main section and subsequent subsections within the report (Figure 1). Another method would be to use a scheme of indentations, perhaps combined with changes in the font size, to delineate between sections and subsections. Note that this same ordering sequence would also be used in the table of contents.

For reports on survey results, it is strongly suggested that the body of the report be organized to correspond to the stated goals of the survey that provided the information being presented in the report. Each section should have a number and a title. Within each section, four subsections should be considered:
-
Survey Results. These are related to the goal and should be presented in a separate section heading. Survey results present the summarized responses of survey respondents to those questions related to the specific goal being addressed. Generally speaking, this information will be presented in tables and figures.
-
Other Information. Documents findings and recommendations and may be presented in the same manner as the survey results or in narrative form. Other information may come from the community profile presented in the introduction to the report or from another report that is readily available to the readers.
-
Findings. These are based on the information from the survey or the background on the community and should be presented in a separately labeled subsection.
-
Recommended Actions. This is the final subsection under each major section. Recommended actions should refer back to specific findings using the numbering system that identifies the related survey results and findings that the recommended action addresses.
Using Graphics in Reports
Graphics (tables, figures/graphs, and pictures) can enhance the readability of a report by pictorially depicting data, as well as emphasize significant information and substantiate findings, conclusions, and recommendations contained in the report. Placement and content are keys to increasing the usefulness of graphics. Knowing what graphics can convey and when to use particular types of graphics are also important (Hilligoss 2000).
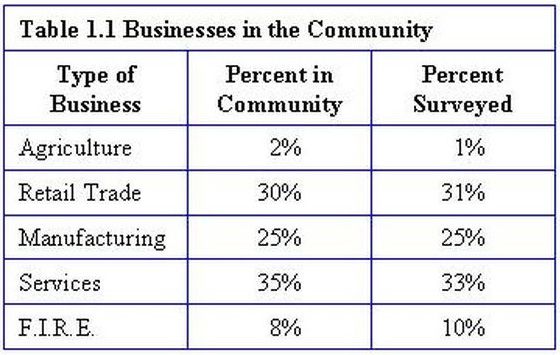
Tables display information in rows and columns. While technically not a graphic, a table is a means of visually displaying information (Figure 2).
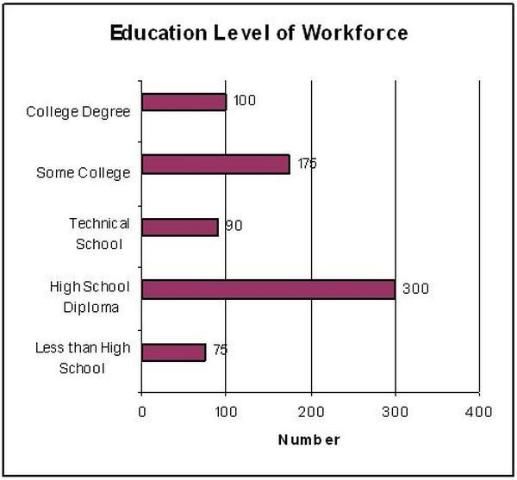
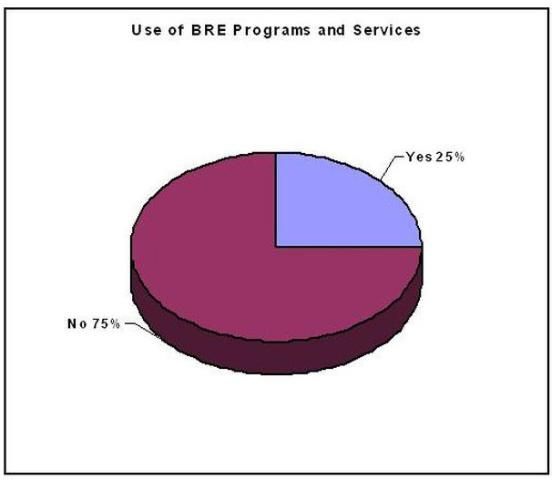
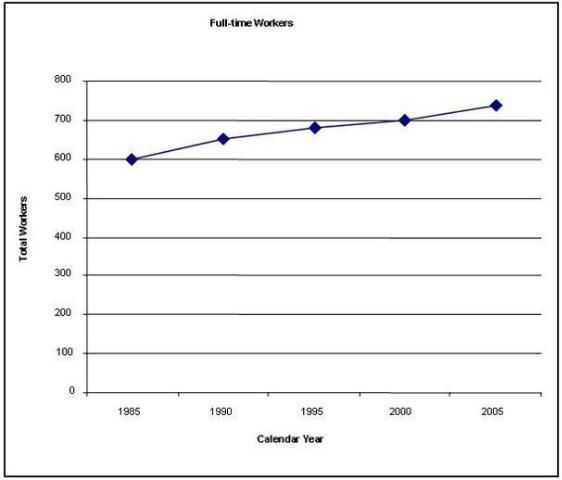
Below are examples of bar, pie, and line graphs:
-
Bar graphs show values across categories
-
Pie graphs show parts in relation to the whole
-
Line graphs typically depict information over time.
All graphics should be labeled with a numbering sequence that corresponds to the section in which it is placed, a title that identifies content, and a sentence or two describing what it depicts.
Conclusion
As its name implies, conclusion wraps up the overall report. The conclusion section may briefly restate the purpose of the report and the data collection methodology. Since specific recommended actions are included in each section of the body of the report, recommendations contained in the conclusion should focus on actions to address the findings and recommendations contained therein. The conclusion should challenge the reader and identify the steps that need to be taken to implement the report.
Appendix
The purpose of the appendix is to provide the reader with information that assists in the interpretation of the body of the report, but which is too lengthy or is not essential to the specific conclusions and recommendations. Each appendix should be labeled with a letter (e.g., Appendix A, Appendix B, etc.) and begin on a separate page. While there is no limit on what might be included as an appendix to the report, relevance to the project described in the report or to the findings and recommendations contained in the report should guide what is included. Typical appendices for BRE reports include
-
A copy of the questionnaire and the summarized results
-
Implementation strategies
-
List of volunteer interviewers (if not identified in the introduction)
-
List of businesses visited (if not identified in the introduction)
Other Considerations
Covers
The cover of a report is not often thought to be important, but it may set the tone for the expectations of the reading audience. Do you use paper or plastic covers? How about plain or fancy covers? What information should be placed on the cover? The cover should attract attention and help convey the content of the report. Photographs or other graphics should be relevant (i.e., they should help identify the location and focus of the study). The information contained on the cover should be very limited and printed in a type size and color that makes it easy to read the information. The following elements are generally accepted as standard items that should be included on the cover:
-
Title of the report
-
Name of report sponsor
-
Name of author (or authors)
-
Affiliation of the author(s)
-
Date of report publication
Binding the Report
There are many ways a report can be bound. Since you wish for these reports to be read and actively used, a ring or comb binding that allows the reader to open the document so that it may be laid out flat is probably best. Choose a ring binder if additional materials may to be added to the report after its publication; otherwise, choose a comb binding.
Transmittal Letters
Most reports are accompanied by a formal transmittal letter. Sometimes referred to as a cover letter, this document may be attached to the outside of the report or bound within the document (Beer and McMurray 2005). The transmittal letter should use a standard business letter or memorandum format, and should identify:
-
The name of the report and the date of its publication
-
The purpose of the report, as well as an overview of key findings and recommendations
-
Sponsors of the report (if external)
Finally, the transmittal letter should conclude with an invitation to those who read the report to follow-up with any questions or comments about the information contained in the report.
Conclusion
"Put it before them briefly so they will read it, clearly so they will appreciate it, picturesquely so they will remember it, and above all, accurately so they will be guided by its light"—Joseph Pulitzer
While Churchill disliked long reports and Pulitzer sugested brevity, the real key to quality reports is focusing on the goals of those who will read what you write. Keeping the reader in mind, following a consistent format, proofreading the report to eliminate typing and grammatical errors, and writing clearly and concisely will improve the quality and worth of the report.
References
Beer, D., and David McMurray. 2005. A Guide to Writing as an Engineer, Second Edition. Hoboken, NJ: John Wiley & Sons.
Hilligoss, S. 2000. Visual Communication: A Writers Guide. New York, NY: Addison Wesley Longman, Inc.
How Project Managers Write Useful Reports. 2019. Dummies.com website. Wiley Publishing. https://www.dummies.com/careers/project-management/how-project-managers-write-useful-reports/
The Structure of Business Reports. 2000. Unilearning website. University of Wollongong. http://unilearning.uow.edu.au/report/4b.html