A Review of Watermelon Production and Price Trends from 2010 to 2021
Overview
Watermelons are primarily produced by eight states on over 100,000 acres each year (USDA-NASS 2022). Most of the fruit (almost 80%) are cultivated in California, Florida, Georgia, and Texas with Florida leading in domestic production (USDA-ERS 2020a). In 2019, Florida’s watermelon output accounted for 25.2% of total US production, 24.7% of national watermelon acreage, and 29.6% of the overall crop value in the United States (USDA-NASS 2021). The value of Florida's watermelon output accounted for 13.2% of the state's total vegetable production (USDA-NASS 2021). In 2021, the value of watermelon produced in the United States totaled $534 million, and production totaled 34.1 million hundredweight (cwt; 1 cwt equals to 100 pounds) (USDA-NASS 2022). These values show declines from 2020 values, both in the value of watermelon produced and in total production, by 7% and 1%, respectively (USDA-NASS 2022).
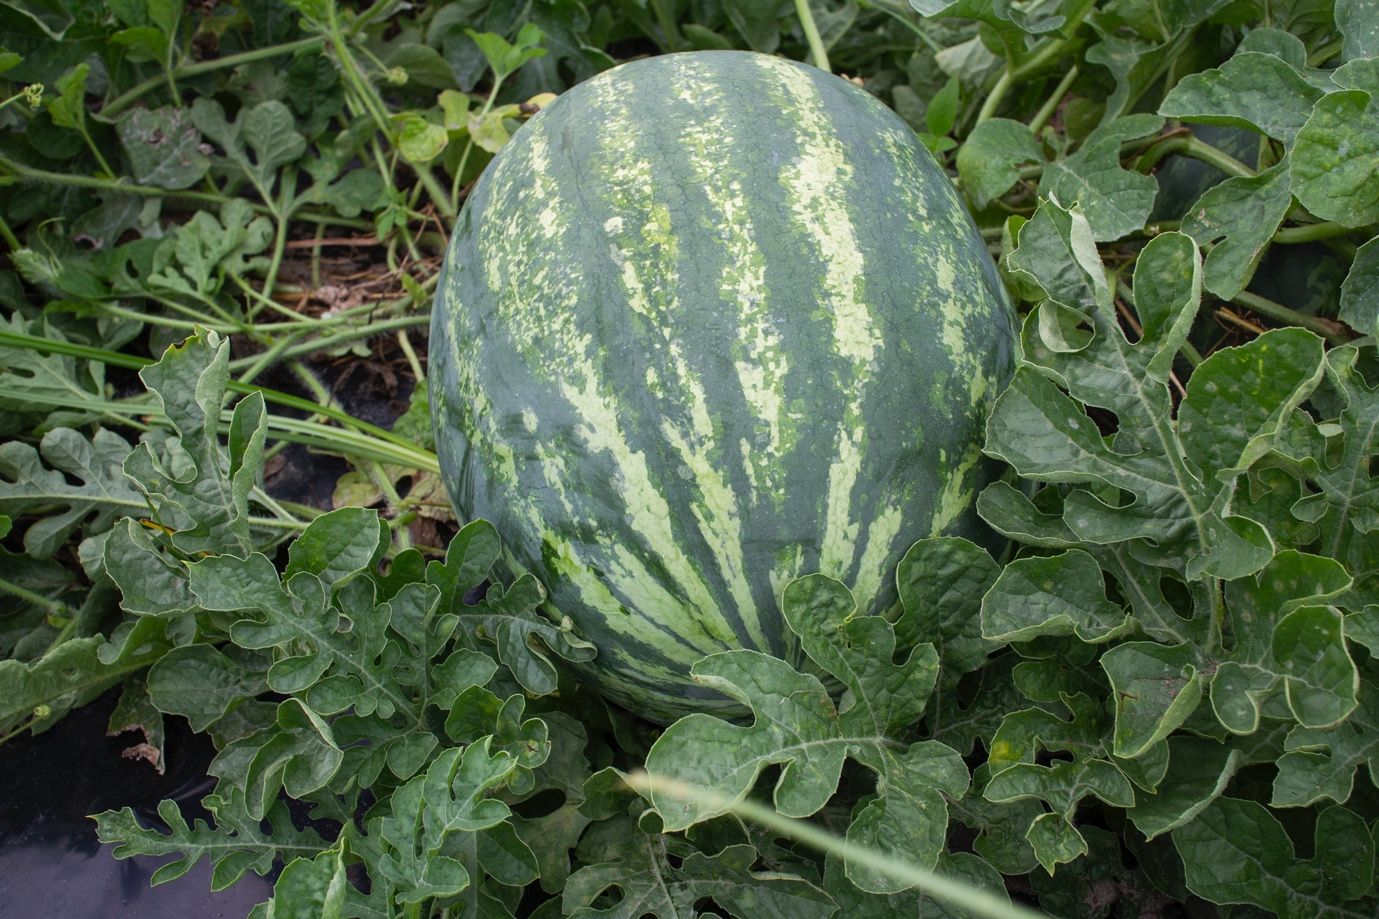
Credit: UF/IFAS Extension file photo
This publication provides information on both seeded and seedless conventional watermelon acreage, volume, and pricing for California, Florida, Georgia, and Texas from 2010 through 2021. It is one of a series of EDIS publications that illustrate trends in Florida’s five most economically important specialty crops in 2020, excluding citrus: tomatoes, bell peppers, watermelons, sweet corn, and strawberries (FDACS, 2022). This information will be useful to producers, Extension agents, and others interested in trends concerning specialty crop commodities. The publication provides information about specialty crop market and production trends.
Data and Methods
Data on acres harvested, price received, and production value per acre for fresh-market watermelons are from the United States Department of Agriculture National Agricultural Statistics Services (USDA-NASS). These data are averaged for the market year and allow us to show trends in watermelon production and prices over time. To assess marketable watermelon volume from each state on a year-to-year basis, we examine the truck shipment (movement) data from the USDA Agricultural Marketing Service (USDA-AMS). This data describes the volume of watermelons transported domestically in 40,000-lb-capacity refrigerated trucks over the interstate highway system, from farms to distribution centers and destinations for international shipments. It therefore does not include watermelons transported in box trucks or by rail or other means. It describes only those watermelons transported by 40,000-lb-capacity refrigerated trucks and not the total volume of watermelons produced.
We obtained aggregated yearly data for watermelons (seeded and seedless combined) from 2010 to 2021 in the top four producing states listed above. The figures below compare historical trends in these states for the number of acres of conventional watermelon harvested, price per cwt (100 pounds), value of production per acre, and volume of watermelon transported by 40,000-lb-capacity refrigerated trucks.
Results
Over the past 12 years, Florida had the greatest average acreage harvested with 22,616 acres per year. Texas ranked second to Florida, on average, with 22,016 harvested acres per year, followed by Georgia at 20,291 acres per year, and California at 10,525 acres per year. Florida has led the nation in acres of watermelon harvested since 2019 and had a record harvest of over 26,400 acres in 2021 (Figure 2). In 2020, harvested acres in Texas decreased due to disease introduced by whiteflies (Adams, 2020). California averages less than 15,000 fresh-market acres harvested between 2005 and 2015, with a record high of 12,700 acres harvested in 2010.
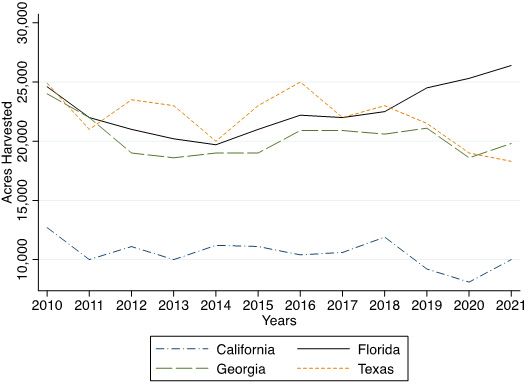
Credit: USDA-NASS
For prices received by weight (Figure 3), Florida shows an all-time high in the United States at $25 per cwt in 2013. California and Texas, on the other hand, have highs of $21 and $18.50 per cwt, in 2019 and 2018, respectively. Peak seasons can provide some explanation for why various states receive different prices. Among the top producing states, Florida is the only state that supplies watermelons from December to April (Mossler and Fishel 2013), allowing growers to take advantage of higher seasonal prices. Georgia watermelons received high demands from June to August (Coolong and Granberry 2017). Further, market destinations can influence price received by states. California’s watermelons are marketed in the western part of the United States and in Canada (Baameur et al. 2009). Georgia, on the other hand, markets most of its crops to east Mississippi, the Midwest, the Northeast, and Canada (Coolong and Granberry 2017). In 2018, Florida watermelons were valued at almost $2 per cwt more than California, while yields in both states were nearly same. In recent years, particularly in 2020, the price per cwt in Florida increased by two cents ($0.02), despite marketing and supply chain disruptions caused by the COVID-19 pandemic (USDA-NASS 2021). In 2021, Florida saw an increase in price by 3% from 2020 (Figure 3).
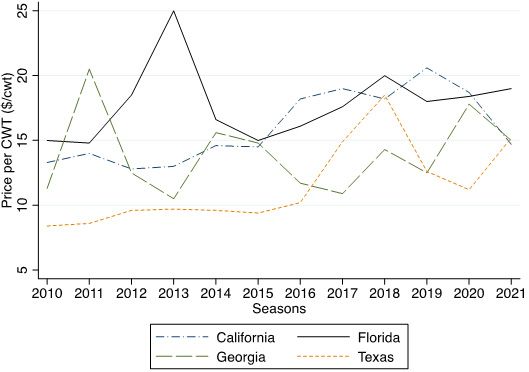
Credit: USDA-NASS
Figure 4 shows the value of production per acre. Though California-harvested acres are lowest among the top four watermelon-producing states, their per-acre value of production was higher than that of most states from 2010 to 2017. In 2018, their per-acre value of production dropped substantially and remained lower than Florida’s until 2020. Higher than typical prices observed in 2013 (Figure 3) resulted in Florida grossing the highest per-acre value of almost $8,000 in 2013 (Figure 4). For California, the value of production per acre increased steadily between 2015 and 2017 from almost $8,000 to $11,000, outpacing Florida's increase. The value of production for Florida and Texas followed a similar trend to prices received (Figure 3).
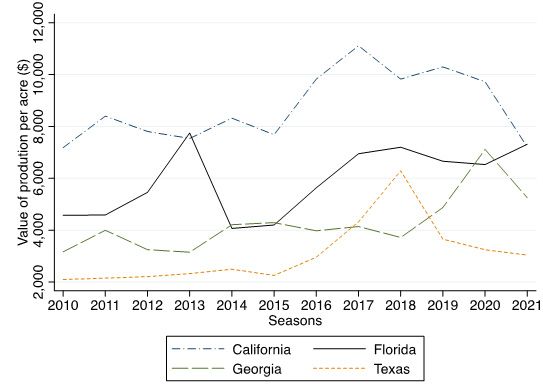
Credit: USDA-NASS
Watermelons are best shipped in refrigerated trucks. It is recommended that shippers follow Louisiana State University AgCenter's watermelon storage and transportation directions (Malekian et al. 2015). Florida observed yearly increases in the volume of watermelon shipped with a high of over 1 million lbs. in 2021 (Figure 5) Florida’s 2021 volume is more than 42%, 56%, and 67% higher than volumes from Georgia, Texas, and California, respectively. Additionally, favorable weather conditions allowed Florida to compete with Georgia and Texas between 2018 and 2019 (USDA-ERS 2020b). On the other hand, California and Texas saw decreases in volumes in 2019 and 2020, respectively. The Texas Crop and Weather Report reported fewer shipments from the Lower Grande Valley as a significant contributor to Texas’s decreased shipment (Adam, 2020). After steady yearly volumes between 2013 and 2017, California observed a 13% rise in their top five commodities, including watermelons, resulting in an increase in truck movements in 2018 (USDA-AMS 2018). Although in 2020 agricultural shipments were severely impacted by COVID-19, Florida observed record volume shipped in 40,000-lb-capacity refrigerated trucks while other leading producing states showed a decline.
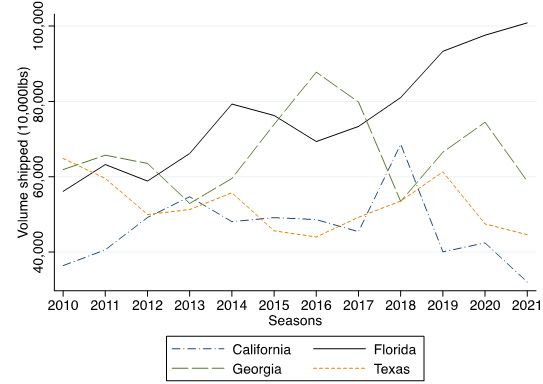
Credit: USDA-AMS
Summary
We provide trends in watermelon acres, prices, production value per acre, and shipments for Florida and other top producing states. These data show that over the past 12 years, including 2021 despite recent supply chain interruptions, Florida has been a leading watermelon producer.
Acknowledgments
This work is supported by the USDA National Institute of Food and Agriculture, Specialty Crops Research Initiative project award 2019-51181-30010 and the Multi-State Hatch FL-SWF-005724, “Economic Valuation and Management of Natural Resources on Public and Private Lands (W5133).”
Reference
Adam, R. 2020. Watermelon prices and quality high. Texas Crop and Weather Report, June 3, 2020. https://agrilifetoday.tamu.edu/2020/06/03/texas-crop-and-weather-report-june-3-2020/
Agricultural Marketing Resource Center. 2021. AgMRC Website. AgMRC. (Assessed June 2022) https://www.agmrc.org/commodities-products/vegetables/watermelon
Bertelsen, D., J. Harwood, F. Hoff, H. Lee, A. Perez, S.Pollack, A. Somwaru, and G. Zepp. 1994. Watermelons: An Economic Assessment of the Feasibility of Providing Multiple-Peril Crop Insurance. USDA Economic Research Service in cooperation with the University of California for the Federal Crop Insurance Corporation.
Bunning, M. 2022. Watermelon. Food Source Information, Colorado Integrated Food Safety Center of Excellence. Website. (Assessed July 2022) https://fsi.colostate.edu/watermelon/#consumption
Coolong, T., and D. M. Granberry. 2017. Commercial Watermelon Production. University of Georgia Extension. https://extension.uga.edu/publications/detail.html?number=B996&title=commercial-watermelon-production
Dittmar P. J., S. Agehara, and N. S. Dufault. 2021. Vegetable Production Handbook of Florida, 2021-2022. HS710/CV100. EDIS 2022. doi.org/10.32473/edis-cv292-2022
Elwakil, M. W., N. S. Dufault, J. H. Freeman, and M. A. Mossler. 2022. “Florida Crop/Pest Management Profile: Watermelon.” CIR1236/PI013. EDIS 2022. https://edis.ifas.ufl.edu/publication/PI031
FDACS (Florida Department of Agriculture and Consumer Services). Florida Agriculture Overview and Statistics - Florida Department of Agriculture & Consumer Services. 2022. Retrieved March 20, 2023, from https://www.fdacs.gov/Agriculture-Industry/Florida-Agriculture-Overview-and-Statistics#
Georgia Department of Agriculture. 2022. Georgia Grown Watermelons. https://georgiagrown.com/find-georgia-grown/fruits-vegetables/watermelons/
Malekian F., A. Adhikari, C. Graham, K. Fontenot, and M. L. L. Ivey. 2015. Transportation of Fresh Produce: Best Practices to Ensure On-farm Food Safety. Louisiana State University AgCenter. https://www.lsuagcenter.com/~/media/system/8/e/2/e/8e2ed6a0caf7c90715aadbea4be70c9b/2_pub3442_transportationoffreshproduce_finalpdf.pdf
Mossler, A. M., and F. M. Fishel. 2013. Crop Profile for Watermelon in Florida. https://ipmdata.ipmcenters.org/documents/cropprofiles/FLwatermelons2013.pdf
Russell A. 2018. Texas watermelon, cantaloupe producers fare well due to growing conditions, demand. Waco-Tribune-Herald. https://wacotrib.com/texas-watermelon-cantaloupe-producers-fare-well-due-to-growing-conditions-demand/article_319b2bad-1389-5c0b-b32c-865e598b4563.html#:~:text=Texas%20watermelon%2C%20cantaloupe%20producers%20fare%20well%20due%20to%20growing%20conditions%2C%20demand,-By%20ADAM%20RUSSELL&text=Dry%2C%20sunny%20days%20around%20most,grow%20relatively%20free%20of%20disease.
Smith, D. and J. Anciso. 2000. Watermelons in Texas. Texas A&M AgriLife Extension, Crop Briefs. https://aggie-horticulture.tamu.edu/vegetable/guides/crop-briefs/watermelons-in-texas/
Truckload Shipping. 2020. How Are Watermelons Transported? https://usatruckloadshipping.com/how-are-watermelons-transported/#:~:text=According%20to%20the%20Louisiana%20State,for%20freight%20shipping%20the%20watermelons
USDA-AMS (United States Department of Agriculture, Agricultural Marketing Service). 2018. Agricultural Refrigerated Truck Quarterly. USDA-AMS, Washington, DC https://www.ams.usda.gov/sites/default/files/media/RTQ3rdQuarter2018.pdf
USDA-AMS (United States Department of Agriculture, Agricultural Marketing Service). 2020. Specialty crop 10,000 lb. movement. USDA-AMS, Washington, DC
USDA-AMS (United States Department of Agriculture, Agricultural Marketing Service). 2021. Agricultural Refrigerated Truck Quarterly. USDA-AMS, Washington, DC. https://www.ams.usda.gov/sites/default/files/media/RTQ2ndQuarter2021.pdf
USDA-ERS (United States Department of Agriculture, Economic Research Service). 2020a. U.S. watermelon imports rise to meet growing demand. USDA-ERS March 31, 2020. https://www.ers.usda.gov/data-products/chart-gallery/gallery/chart-detail/?chartId=98750
USDA-ERS (United States Department of Agriculture, Economic Research Service). 2020b. Fruit and Tree Nuts Outlook. USDA-ERS March 31, 2020. https://www.ers.usda.gov/webdocs/outlooks/98171/fts-370.pdf?v=670.4
USDA-NASS (United States Department of Agriculture, National Agricultural Statistics Service Information). 2021. Vegetables 2020 Summary. USDA-NASS, Washington, DC. https://downloads.usda.library.cornell.edu/usda-esmis/files/02870v86p/j6731x86f/9306tr664/vegean21.pdf
USDA-NASS (United States Department of Agriculture, National Agricultural Statistics Service Information). 2022. Vegetables 2021 Summary. USDA-NASS, Washington, DC. https://downloads.usda.library.cornell.edu/usda-esmis/files/02870v86p/zs25zc490/9593vz15q/vegean22.pdf
USDANASS (United States Department of Agriculture, National Agricultural Statistics Service Information). Quick Stats. USDA-NASS, Washington, DC. https://quickstats.nass.usda.gov