Choosing the Right Visual for Social Media: Comparing the Engagement of Stock Photos Versus Natural Photos
Introduction
Extension educators have used social media as a marketing tool for programming for over a decade (Garcia et al., 2018; O’Neill, 2019), and social media is an important piece of Extension outreach efforts (Gharis et al., 2014). Across many different platforms, photos or graphics accompanying social media posts have repeatedly yielded greater results, in terms of engagement and success (Doyle & Briggeman, 2014; Harvey, 2016; Li & Xie, 2020). Thus, it is imperative to include a visual element with each social media post because it would be considered a missed opportunity without one (O’Neill, 2019). But most importantly, does it make a difference which visual is used within the post? This question was posed to the Center for Rural Enterprise Engagement (CREE) team by a participant during an Insight Summit conference, a news-media marketing conference hosted annually by CREE. Although several perspectives on best practices for social media exist, the CREE team wanted to provide a recommendation that was grounded in research and specific to its audiences. In this publication, you will find background information on visual elements in social media, specific details of how we conducted this study, our research findings, and implications for content creators moving forward. This publication explores the question of whether stock images are as effective as natural images and recommends social media strategies to content creators, who are Extension educators and agricultural small-business owners.
Background
Content creators have many choices when it comes to deciding which visual elements to utilize. Personal photos, which are referred to as natural photos in this publication, as well as graphics, stock images, GIFs (Graphic Interchange Format), and videos can all be visual elements (O’Neill, 2019). In smaller organizations or businesses, those conducting outreach efforts may be responsible for many other duties on top of social media marketing and may have fewer resources in terms of organizational photo libraries and team members to gather organizational photos. In this situation, people often seek out stock photos as a visual element.
The stock photo business is projected to be a $4 billion industry by 2023 and has experienced an annual growth of 5% since 2017 (Attié, 2019). Those working in outreach positions have sometimes been cautioned against using stock photos because they can appear commercialized (Moran et al., 2019), seem cliché or inauthentic, or require an understanding of copyright and licensing agreements (Breck, 2018). On social media, images can quickly go viral and choosing specific imagery can influence the viewer and their emotional response (Lim & Childs, 2020; Zontone et al., 2009). Therefore, content producers need to understand the impact visuals can have on audiences. To empirically understand this relationship, we sought to identify if there was a difference in engagement when using stock or natural photos in an outreach organization. For the purposes of this research, natural photos refer to personal photos or visuals, captured or created by an individual or company that manages the social media page, excluding stock photos.
Approach
To fulfill this research objective, we selected one outreach organization with agricultural stakeholders and followers. The organization had 634 followers at the time of data collection in 2019. Individual Facebook post data from January 1 to December 1, 2019 (n = 115) were downloaded through Facebook’s Insights analytics. Using SPSS, a statistical software, photos were coded into two categories: stock or natural photos. The content or composition of the photos varied, but all related to the overall mission of the organization, which was a mix of agriculture, marketing, and new and social media. To compare engagement rates, an independent sample t test was run with each category of photos, which compared the average engagement rate when using stock photos with the average engagement rate when using natural photos. Engagement rates were calculated at the post level using the formula of engaged users (likes + reactions + comments + shares) divided by total reach (followers), which is used and accepted in social media marketing metrics (Doyle et al., 2023).
Findings
There was a significant difference in mean (average) scores for the engagement rates of stock (n = 58, M = .06, SD = .04) and natural photos ([n = 53, M = .21, SD = .68]; t[52.35] = 1.62, p ≤ .05). Cohen’s d was used as a test for effect size, which for this analysis (d = .31) was found to be of small to medium effect (Cohen, 1988). This suggests using natural photos has a positive effect on engagement rate. Specifically, when natural photos are used instead of stock photos, the engagement rate of posts more than triples.
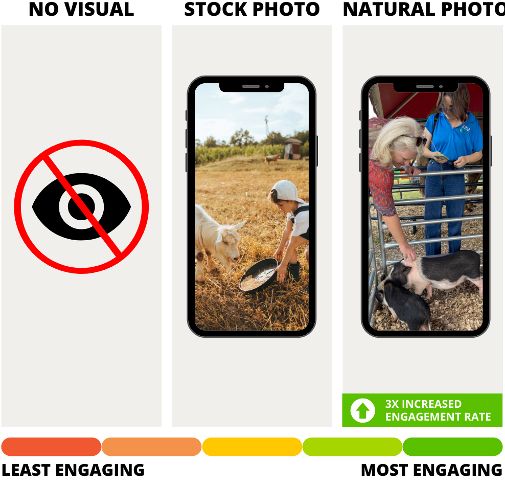
Credit: Aly Morrison, UF/IFAS
What Does This Mean for Content Creators?
In conclusion, for this single agricultural organization, stock photos were significantly less engaging than natural photos when used in Facebook posts. Based on the results from this research, it is recommended that content creators strive to create and deploy their own photos for posts that are novel and exude authenticity (Breck, 2018). Authenticity is defined many ways in many different contexts, but specific to imagery, many descriptions revert back to concepts like realness and truthfulness. Since the difference between mean engagement rates for stock and natural photos was low, practitioners should understand that in times of need, a stock photo can produce better engagement than no photo at all (Doyle & Briggeman, 2014; Harvey, 2016). It is also important to keep in mind that the data from this research originated from one specific organization’s Facebook page, so this should be replicated with other organizations before generalizing results.
Overall, we recommend content creators follow best practices for social media (Garcia et al., 2018), such as posting online content in a manner that promotes your brand, serving as an active and consistent presence for your audience (Baker et al., 2021), and invoking multiple senses of your audience using text and visuals (Warwick et al., 2021). It would also be helpful to develop a photo library for use within a business, organization, or a specific Extension program, as this may alleviate pressure to develop natural photos on short notice.
Below and in Figure 2 are some specific examples of how CREE strategically incorporates visuals into its social media strategy:
- Adding the CREE logo and/or watermark to each photo that is posted, regardless of it being a stock or natural photo.
- Selecting photos (stock and natural) that fit and blend well with the CREE brand in terms of content, color, and style.
- Creating similarly structured captions for all photos (i.e., tagging other pages and/or people, using hashtags, spacing, length, etc.).
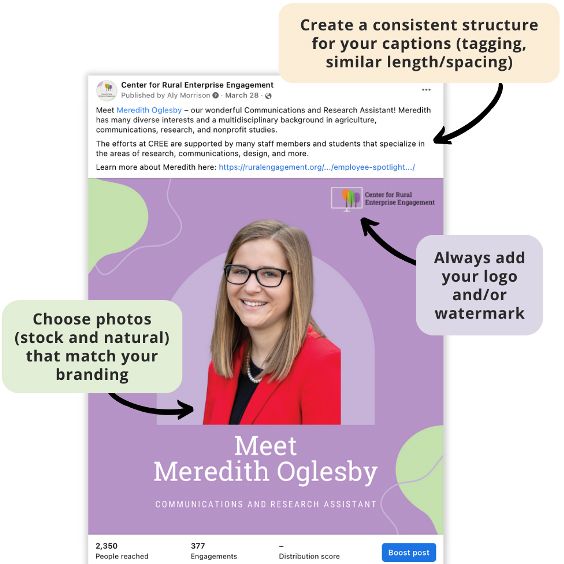
Credit: Aly Morrison, UF/IFAS
Finally, the Facebook posts used as data in this research were implemented prior to the participant question that sparked this idea. Additionally, the organization’s social media content, in terms of stock or natural photos, was not intentionally created for this research. For these reasons, future research should include a more intentional and strategic social media plan to analyze.
Many of these recommendations can be useful and deployed in real-life social media plans for content creators. For example, content creators could examine photo composition and photo details, such as the photo subject, lighting, or angles, to increase the overall understanding of engagement and to identify if a certain element evokes action (Aakhus et al., 2014). Tests could also be conducted to compare engagement rates between different content categories, as these relate to stock and natural photos. Furthermore, A/B split testing could be completed to explore if and/or how messaging plays a role in stock or natural photo engagement, as previous research has noted (Moran et al., 2019). A/B split testing is a way to compare two versions of something to figure out which performs better (Gallo, 2017).
Conclusions
In summary, stock photos are still a great and useful tool in your social media and outreach toolbox. Incorporating visuals should be non-negotiable for content creators looking to make impactful posts online, as it has shown to increase engagement. Specifically for Extension educators and agricultural small business owners, CREE recommends using natural photos, when possible, but if they are not available, use stock photos instead of no visual.
References
Aakhus, M., Agerfalk, P. J., Lyytinen, K., & Te’eni, D. (2014). Symbolic action research in information systems: Introduction to the special issue. MIS Quarterly, 38(4), 1187–1200. https://doi.org/10.25300/MISQ/2014/38:4.3
Attié, I. (2019). The stock photo market: What, who, how and where of stock photos in 2020. Stock Photo Secrets. https://www.stockphotosecrets.com/stock-agency-insights/stock-photo-market.html
Baker, L. M., Warwick, C. R., Fernandez, J. C., & Rumble, J. (2021). Getting the most out of social media: Successfully using social media: WC222/AEC560, 7/2021. EDIS 2021(4). https://doi.org/10.32473/edis-wc222-2021
Blumer, H. (1969). Symbolic interactionism: Perspectives and method. Prentice-Hall.
Breck. (2018, January 31). How stock images can help— or hurt— your brand. https://breckinc.com/2018/01/31/how-stock-images-can-help-or-hurt-your-brand/
Cohen, J. (1988). Statistical power analysis for the behavioral sciences (2nd ed.). Hillsdale, NJ: Lawrence Erlbaum Associates, Publishers.
Doyle, M., & Briggeman, B. C. (2014). To like or not to like: Social media as a marketing tool. The Journal of Extension, 52(3), Article 3IAW1. https://archives.joe.org/joe/2014june/iw1.php
Doyle, O., Baker, L. M., Zagonel, A., & Telg, R. W. (2023). Marvelous metrics: A quantitative content analysis to establish social media benchmarks for Florida fruit and vegetable farms on Facebook. Advancements in Agricultural Development, 4(2), 103–115. https://doi.org/10.37433/aad.v4i2.295
Gallo, A. (2017, June 28). A refresher on A/B testing. Harvard Business Review. https://hbr.org/2017/06/a-refresher-on-ab-testing
Garcia, A. S., Dev, D., McGinnis, C. M., & Thomas, T. (2018). Impact of an Extension social media tool kit on audience engagement. The Journal of Extension, 56(2). https://doi.org/10.34068/joe.56.02.14
Gharis, L. W., Bardon, R. E., Evans, J. L., Hubbard, W. G., & Taylor, E. (2014). Expanding the reach of Extension through social media. The Journal of Extension, 52(3), Article 3FEA3. https://archives.joe.org/joe/2014june/a3.php
Harvey, G. (2016). How using images greatly improves your Twitter engagement. Rethink Media. Retrieved from https://rethinkmedia.org/blog/how-using-images-greatly-improves-your-twitter-engagement
Li, Y., & Xie, Y. (2020). Is a picture worth a thousand words? An empirical study of image content and social media engagement. Journal of Marketing Research, 57(1), 1–19. https://doi.org/10.1177/0022243719881113
Lim, H., & Childs, M. (2020). Visual storytelling on Instagram: Branded photo narrative and the role of telepresence. Journal of Research in Interactive Marketing, 14(1), 33–50. https://doi.org/10.1108/JRIM-09-2018-0115
Mead, G. H. (1934). Mind, self and society: From the standpoint of a social behaviorist. Chicago: The University of Chicago Press.
Moran, G., Muzelec, L., & Johnson, D. (2019). Message content features and social media engagement: Evidence from the media industry. Journal of Product & Brand Management, 29(5), 533–545. https://www.doi.org/10.1108/JPBM-09-2018-2014
O'Neill, B. (2019). Ten tools for creating attention-getting social media messages. Journal of Extension, 57(2). https://doi.org/10.34068/joe.57.02.02
Stryker, S., & Statham, A. (1985). Symbolic interaction and role theory. In Lindzey, G. and Aronson, E. (Ed.), 3rd ed., Handbook of Social Psychology, (pp. 311–78). New York: Random House.
Thomson, T. J., & Greenwood, K. (2017). I “like” that: Exploring the characteristics that promote social media engagement with news photographs. Visual Communication Quarterly, 24(4), 203–218. https://doi.org/10.1080/15551393.2017.1388701
Trevino, L. K., Lengel, R. H., & Daft, R. L. (1987). Media symbolism, media richness, and media choice in organizations: A symbolic interactionist perspective. Communication Research, 14(5), 553–574. https://doi.org/10.1177/009365087014005006
Warwick, C. R., Baker, L. M., Fernandez, J. C., & Rumble, J. (2021). Getting the most out of social media: Strategic practices when using social media: WC223/AEC561, 7/2021. EDIS 2021(4). https://doi.org/10.32473/edis-wc223-2021
Zontone, P., Boato, G., De Natale, F. G. B., De Rosa, A., Barni, M., Piva, A., Hare, J., Dupplaw, D., & Lewis, P. (2009, October 26). Image diversity analysis: Context, opinion, and bias [Paper presentation]. The First International Workshop on Living Web: Making Web Diversity a True Asset, Collocated with the 8th International Semantic Conference, Washington, DC., United States. https://eprints.soton.ac.uk/268168/